
Tidal Datums and Benchmarks for Buzzards Bay
by Joe Costa. Please report errors or send comments about this page to Joe Costa.
Overview
Whether you are interested in historical storm surges, flood plain mapping, relative sea level rise, or are an engineer designing structures along shore, it is important that you have a good understanding of tidal datums, earth geoid models, local benchmarks, and how they relate. Over the years, we have come to realize that many scientists and engineers that work on the coast do not have a full understanding of these elevations, their relationships, or how definitions have changed over time. Although differences in the various datums are less than a foot or two, such discrepancies in designing structures like culverts under roads can have profound implications on tidal flushing and flooding characteristics if these structures are not installed at their appropriate elevations.
We have set up this page to help planners, town engineers, government officials, and scientists quickly find the data and information they need to relate tidal elevations, local benchmarks, and vertical elevation datums to sites around Buzzards Bay. We have also have included sections below that explain the definition of coastlines and maps, and summarize historical storm surges recorded in Buzzards Bay.
Geodetic Vertical Datums
Geodetic vertical datums are the zero reference points from which we measure elevations. Generally they are thought of as the elevation of "sea level," although they do not typically coincide with the actual local mean sea level for a particular location because of variations in gravity and and water levels across the earth. In maps and site plans used in the United States, the two most common geodetic vertical datums used are the National Geodetic Vertical Datum of 1929 (NGVD 29) and North American Vertical Datum of 1988 (NAVD 88).
The Sea Level Datum of 1929 and NGVD29
Prior to the 1980s, the Sea Level Datum of 1929, called today the National Geodetic Vertical Datum of 1929, or NGVD29, was the standard definition of zero elevation (=datum) for measuring elevations on land. It was the average elevation of sea level at 21 tide gauge stations in the United States and 5 in Canada. This datum was also often referred to generically and loosely as "Mean Sea Level" (MSL), although it was not equal to local mean sea level (LMSL). Thus for decades, NGVD 29 was the basis for reporting the elevations of hills, mounts, and contours on topographic maps, and structures. Because the datum was often confused with local mean sea levels (LMSL), in 1973, the federal government (US Geological Survey or USGS) renamed this zero reference elevation as the National Geodetic Vertical Datum of 1929. Older engineering plans, and occasionally some recent engineering plans, may incorrectly refer to the NGVD 29 zero elevation as "mean sea level". Most engineers today, if not using a relative local benchmark, will use the newer NAVD 88 datum instead.
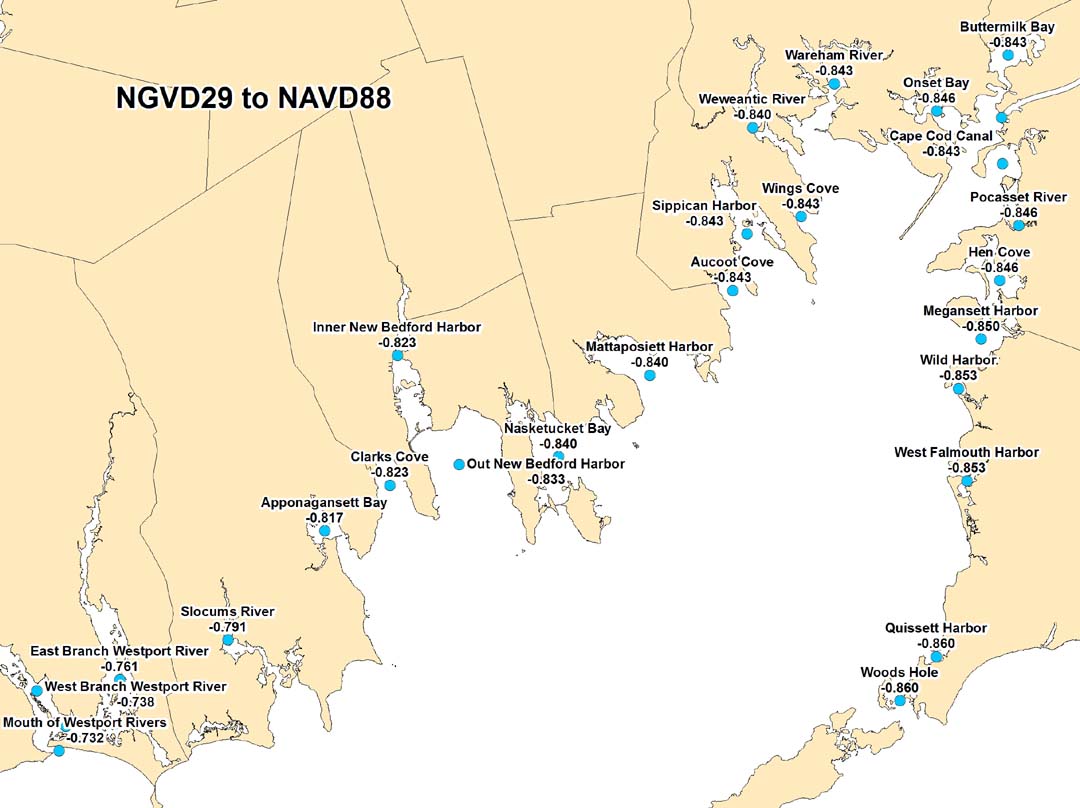
Click the map to enlarge. There is a 1.5 inch difference between Westport and Woods Hole.
North American Vertical Datum of 1988
Because NGVD 29 had various deficiencies in expressing elevations in different locations, problems in updating the data because of sea level rise, and variations in relative sea level rise because of land uplift and subsidence, the USGS abandoned NGVD 29, and replaced it with the North American Vertical Datum of 1988 (NAVD88, adopted in 1993) that used a different method for establishing a "zero" elevation that could be applied over a large geographic area. For the Buzzards Bay region, NAVD 88 is about 10 inches above NGVD29. LMSL varies around Massachusetts. In Woods Hole LMSL is 6 inches above NGVD 29 and -4.5 inches below NAVD88. See table and chart below.
Tidal Datums
In our area we have mixed semi-diurnal tides. These are slightly asymmetrical high and low tides that occur twice over a 24 hour 50 minute period. Consequently, on most days we have two high tides and two low tides. One of these low tides is lower than the other, and one of the high tides is higher than the other. These two tides are described as the "lower low" tide and the "higher high" tide respectively. The heights of these semi-diurnal tides change over the course of the month because of the relative alignment of the moon and sun which both exert gravity on the oceans to create the tides. When the moon and sun are aligned (new moons and full moons), the higher highs are higher and the lower lows are lower, and these are referred to as "spring tides." New moon spring tides are more extreme than full moon spring tides. These occur every two weeks). The midpoint between spring tides (also every two weeks), are called "neap tides", which are the periods of the smallest tide ranges.
Tidal datums are 19-year averages of all tides in an area. The zero value of the datum is the average of the Mean Lower Low Water (MLLW) heights over the 19-year period called a tidal epoch. The values of the Local Mean Sea Level (LMSL), as well as Mean Low Water (MLW), Mean High Water (MHW), and Mean Higher High Water MHHW are the average of each of these terms for the 19 year epoch, relative to the MLLW average. Every 25 years or so, the federal government revises these tidal datums by examining new "epochs" of data to account for relative sea level rise. "Mean Tide level" (MTL) is just the mean of the MHW and MLW values, although it is generally very close in value to LMSL. Sometimes these elevations are reported to the "station datum," which is the zero elevation of the tide gauge staff (see this example from the NOAA Tides and Currents page
Tidal elevations recorded at the Woods Hole tide station, including highest values recorded can be found at: NOAA Tides and Currents Woods Hole Benchmarks

The tides on the date shown were during a "neap tide" period of diminished high and low tides due to the relative positions of the sun and moon. The zero foot elevation in this graph is the tidal datum, which is set to MLLW.
This Woods Hole tide chart is atypical for Buzzards Bay because Woods Hole is in a node between the Newport tidal regime and the Boston tidal regime, so tides are damped here. Below is a two-week predicted tidal record for outer New Bedford Harbor by the hurricane barrier. Notice that the tidal range (3.6 ft) is greater than Woods Hole. Note also that MHW is about 1.4 ft NAVD 88 in Woods Hole, whereas in Woods Hole it is about 0.4 ft NAVD. The highest spring tide in May 2013 is about 3 feet NAVD.

Relationship Between Tidal Datums, Vertical Datums, and Local Benchmarks
The relationship between tidal datums (average tide heights, the datum is MLLW=0), vertical datums (land elevation, datum=0, sometimes incorrectly referred to as mean sea level), and local benchmarks (brass elevation markers found on bridges, roads, and occasionally large rocks) varies up and down the coast of the US and elsewhere.
Below is a diagram of the relationship between the tidal datums and the NGVD 29 and NAVD 88 datums for Woods Hole, MA. Refer to this diagram as you read the sections below it.
| Tidal State | Tidal Datum (meters) | Tidal Datum (feet) | NAVD88 ft | NGVD 29 ft |
| MEAN HIGHER HIGH WATER (MHHW) | 0.672 | 2.198 | 0.841 | 1.701 |
| MEAN HIGH WATER (MHW) | 0.588 | 1.923 | 0.566 | 1.426 |
| 1988 North American Vertical Datum NAVD88 | 0.415 | 1.357 | 0.000 | 0.860 |
| MEAN TIDE LEVEL (MTL) | 0.315 | 1.030 | -0.327 | 0.533 |
| MEAN SEA LEVEL (MSL) | 0.300 | 0.981 | -0.376 | 0.484 |
| 1929 National Geodetic Vertical Datum (NGVD29) | 0.152 | 0.497 | -0.860 | 0.000 |
| MEAN LOW WATER (MLW) | 0.043 | 0.141 | -1.217 | -0.357 |
| MEAN LOWER LOW WATER (MLLW) | 0.000 | 0.000 | -1.357 | -0.497 |
Note: For Woods Hole, elevation[NAVD88 ft]= elevation[NAVD29 ft] -0.860 ft.
Woods Hole is near a node between the Boston and Newport tidal regimes, and the tides are greatly diminished there. Compare the same information for Clarks Point New Bedford in the table below, which has a more typical tidal range for Buzzards Bay.
| Tidal State | Tidal Datum (meters) | Tidal Datum (feet) | NAVD88 ft | NGVD 29 ft |
| MEAN HIGHER HIGH WATER (MHHW) | 1.21 | 3.96 | 1.99 | 2.82 |
| MEAN HIGH WATER (MHW) | 1.13 | 3.71 | 1.74 | 2.57 |
| 1988 North American Vertical Datum NAVD88 | 1.97 | 1.357 | 0.00 | 0.83 |
| MEAN TIDE LEVEL (MTL) | 0.59 | 1.93 | -0.40 | 0.79 |
| MEAN SEA LEVEL (MSL) | 0.51 | 1.67 | -0.30 | 0.53 |
| 1929 National Geodetic Vertical Datum (NGVD29) | 1.14 | 0.83 | -0.860 | 0.000 |
| MEAN LOW WATER (MLW) | 0.04 | 0.14 | -1.83 | -1.00 |
| MEAN LOWER LOW WATER (MLLW) | 0.00 | 0.00 | -1.97 | -1.14 |
Problems and Issues
While historical tidal records have been tied to a specific tidal datum benchmark, in a surprising number of cases, the real world elevation of these benchmarks have never been documented and published.
Links
Tidal elevations recorded at the Woods Hole tide station, including highest values recorded can be found at:
NOAA Tides and Currents Woods Hole Benchmarks
Anyone determining or calculating MHW elevations will find these web pages especially useful:
NOAA tides and Currents Page (enter a location, the resulting page includes links to tidal benchmarks)
NOAA online NGVD 29 to NADD88 calculator (enter a longitude, latitude, and a height to convert)
NOAA NGS Datasheets
NOAA CO-OPS Tidal Benchmarks
NGS Geodetic Tools Fact Sheet
What is the Coastline on Maps?
On both USGS topographical "Quad" maps and NOAA nautical charts (as well as GIS data files derived from these), the coastline is generally the Mean High Water (MHW) mark. The coastline is not the 0 ft land elevation contour. The land elevation varies around the coast. In Buzzards Bay, MHW is roughly at the 2 ft land elevation (NAVD88 datum).
We say the coastline is "generally" the MHW mark because there are important exceptions. One of these exceptions is where salt marshes occur. Where there is a salt marsh, the "apparent coastline" is shown, not the MHW mark. The apparent coastline is the extent of the salt marsh vegetation. Because salt marsh can grow down to just below the mid-tide level, the coastline on maps is closer to the 0-foot land elevation (NAVD88 datum) in Buzzards Bay. The apparent and MHW coastline is illustrated in the portion of a nautical chart shown below.
Land elevations versus bathymetric depth
Land elevations on federal government maps produced after 1990 are generally given as feet above NAVD 88 (North America Vertical Datum 1988), which is now the most recently accepted "zero" elevation for North America. Earlier maps use NGVD 29 (National Geodetic Vertical Datum 1929) including the previous FEMA flood maps. Until recent years, data used by local engineering firms, and the elevations on most site plan submitted to municipal boards used the NGVD 29 datum. All new FEMA maps are now being released in NAVD 88 (go to our floodplain information page).
Bathymetric depths for nautical charts and topographic quads in our area are generally given as feet below mean low water (MLW) on maps prior to 1990, and depth below mean lower low water (MLLW) after 1990, however, always check the tidal datum definition for the chart because it varies. In Buzzards Bay, the difference between the MLW mark and MLLW mark is generally around 4 inches, but varies around the bay.
As might be apparent from the above definitions, there are areas in the intertidal zone which have negative land elevations and negative bathymetric elevations.
Keep in mind, when reviewing plans for sites around Buzzards Bay, subtract about 10 inches (the value varies slightly across the region) from NGVD 29 elevations to get NAVD 88 elevations. Use the NOAA online NGVD 29 to NADD 88 calculator to determine the exact conversion.
Legal Case on MLW definition
An interesting recent Lands Court case that helps define ownership of intertidal areas was upheld by an Appeals Court in 2010 (and affirmed in 2011 by the Massachusetts Supreme Court in its failure to take the case on an appeal). The case was a dispute in ownership between the town of Manchester-by-the-Sea and a private property owner, who removed some private moorings from tidal flats that he believed he owned. The case was decided based on a history of ownerships and land grants going back to colonial times, but the most important transferable outcome of the case was the fact that the court adopted a specific legal definition the "low water mark" shall be defined as the "Mean Low Water" for coastal property boundary cases. The judge concluded that the boundary line of MLW should be set to an elevation based on the National Geodetic Vertical Datum. The court wrote, "'mean low water' as established by the National Geodetic Vertical Datum (NGVD), is the appropriate standard for determining the low water mark". Read more about the case in this Massachusetts Bureau of Municipal Finance Law article on Spillane v. Adams, 76 Mass. App. 378 (2010) (pdf), and at the Massachusetts Law Library beach Rights page.
To those familiar with the application of elevation datums, this decision may seem, at first, inappropriate, because the NGVD datum is four feet above the MLW elevation (see figure below). The judges in the case also called it the "NGVD mean low water datum," but this is not the correct terminology. NGVD(29) is a datum (zero elevation), and it does not set the mean low water mark, which is based on tidal datums. Footnote 27 is also factually incorrect by stating that the mean water level is equivalent to MLLW. MLLW is the tidal datum, but it is not equal to mean water level or mean sea level. Although the wording of some elements of the decision are imprecise or incorrect from a technical perspective, the outcome of the case (that MLW can be tied to a specific elevation according to a vertical datum) can be understood by a careful reading of the decision, and by reviewing references to the Land Court decision. For example, the judge did cite a decision another case (Houghton v. Johnson, 14 Mass. Land Court Rptr. at 447 Land Court No. 308323 [KCL]) with more precise language: "For purposes of setting boundaries, the greatest need is certainty. The best way to establish a clear line which will be: (a) respected by the parties (because it is based on objective data), and (b) easiest to enforce (because its results are repeatable), is to use the Mean High Water Elevation and Mean Low Water Elevation lines, placed according to NGVD data ... [emphasis added]." Although not explicitly mentioned in the decision, Mean Low Water (is an elevation based on separate local tidal datums that can be set to a particular land vertical elevation datum (in this case NGVD29) and applied to plans. This contrasts with demarcating a MLW boundary based on low tide observations on any particular day (as happened in this case). The map below shows the change in property bound set by the Land Court decision, and the table to the right shows the elevation of MLW based on the tidal datum near Manchester-by-the-Sea as contained in a National Geodetic Survey database. As shown in that table, MLW in the area of Manchester-by-the-Sea is -4.31 ft NGVD 29 and -5.12 ft NAVD88. Note that tidal datums (0 feet) is set to Mean Lower Low Water (MLLW), and in this case, MLW is 0.34 feet above the tidal datum.
For the purposes of local regulations, municipalities should require MLW be demarcated on site plans using National Geodetic Survey database tidal datums referenced against plan elevations (typically NGVD 29 or NAVD 88).


Left: Diagram from Appeals Court decision showing demarcations of MLW considered. Right: National Geodetic Survey database tidal datums compared to NGVD for a station near Manchester by the Sea, Massachusetts.
Past Hurricanes Tidal Surges in Buzzards Bay
NOAA Summaries for the four worst storms affecting southern New England are in the links below.
The 1938 Hurricane
Hurricane Carol, 1954
Hurricane Edna, 1954
Hurricane Bob, 1991
Environmental Management Issues Sea Level Rise
Sea level has repeatedly risen and fallen over geologic time with the formation of large glaciers during ice ages, and the melting of this glaciers and polar ice during intervening warm periods. Since the last ice age 10,000 years ago, sea level has continued to rise, with the rate of relative sea level rise in recent centuries of roughly 10 inches per century. This rate of sea level rise is expected to increase with global warming caused by greenhouse gas emissions, with rates projecting to possibly increase to 20 inches or more per century.
Storms and high seas erode the coast and flood low-lying areas. For environmental managers and regulators today, construction and development in storm flood zones, and areas of high erosion is an important concern, especially in terms of threats to human safety. Also important are the high public financial and economic impacts associated of replacing roads, loss of personal property, and public financing of flood insurance programs and emergency response, particularly in areas repeated damaged by storms. The links to the articles below discuss some of these public policy issues.
Massachusetts Office of Coastal Zone Management Shoreline Change Project.
What would be the impacts of a Hurricane like Isabel on Buzzards Bay? We need only consider the impacts of Hurricane Bob in 1991 (NOAA summary of Hurricane Bob).
For at least 150 years, relative sea level rise in Buzzards Bay has averaged about 10 inches a century. Actual documented sea level changes in Woods Hole since 1930 and data from other sites is available at the NOAA Sea Levels Online website.
