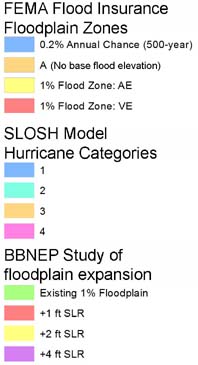
Maps of FEMA 1% floodplain, 0.2% floodplain, SLOSH areas, and BBNEP expansion floodplains
This map includes overlays of FEMA's 1 percent risk ("100-year storm") of flooding as portrayed on their Flood Insurance Rate Maps (FIRMS), FIRM 0.2 percent risk ("500-year storm"), the US Army Corps (SLOSH) maps (nearly equivalent to a 500-year storm), and of the Buzards Bay study of the FEMA expansion of the one percent flood zone with 1-, 2-, and 4-feet increases in sea level.
The Sea Lake and Overland Surge from Hurricanes (SLOSH) model overlay shows worst case Hurricane Surge Inundation areas for category 1 through 4 hurricanes striking the coast of Massachusetts. Hurricane surge values were developed by the National Hurricane Center using the PV2 basin SLOSH Model data. This Surge Inundation layer was created by the U.S. Army Corps of Engineers, New England District. Using ArcInfo's Grid extension, LiDAR bare earth elevation data from USGS, FEMA and MASSGIS were subtracted from the worst-case hurricane surge values to determine which areas could be expected to be inundated.
Most map overlays are several megabytes in size, so layer loading time will vary with internet connection speed. To see a street view of a particular site (if available), drag the person icon onto a road. Click the "x" in the top right corner of the view box to exit street mode.

