Using DEM images to evaluate base flood elevation boundaries
The Buzzards Bay NEP provides technical assistance to Buzzards Bay municipalities on various issues, including using LiDAR data and geographic information system software like ArcMap™. A recent question has arisen as to whether LiDAR digital elevation model images posted at the MassGIS website (2011 Northeast LiDAR DEM tiffs, stored in ERDAS imagine format) can be used to evaluate new flood insurance rate maps (FIRMs) proposed by Federal Emergency Management Agency (FEMA) for Cape Cod. The simple answer is yes. DEMs can be easily color coded to match a specific elevation that corresponds to the base flood elevation in the new FIRMs. By comparing the boundary for the base flood elevation specified in the DEM to the boundary identified in the FIRM, the accuracy of the FIRM can be evaluated.
Displaying DEM elevations in ArcMap™
Step 1. Add the DEM tiff files to your map (if asked to calculate pyramids, say yes).
Step 2. Go into the properties for each DEM file, click Symbology > Classified and specify at 3 classes (if asked to create histograms, say yes).
Note: To create pyramids and histograms in the preceding steps on many files, use the batch tools in ArcCatalog™. There is also a default limit to raster image sizes and some bugs in ArcMap. If you cannot complete step 2 because of a "too many unique values" error, you need to make sure you have installed ArcGIS Desktop Raster Renderer Patches, and have set ArcMap Options to allow a high maximum number of unique raster values to render (set to at least 25 million).
Step 3. While you have the Classified window open at Step 2, click the Classify button. In the Break Value column, enter 0 for the first row, and the base flood elevation in the second row. Don't change the value in the final row. Unfortunately, the elevations in these DEMs is in meters, but the FEMA base flood elevations are in feet. Above right is a feet to meter conversion. For example, if the base flood elevation is 15 feet, enter 4.57 in the second Break Value row. If the DEM covers multiple base flood elevation areas, classify by 4 or more elevations as needed. Keep your first Break Value 0 to preserve a coastline. Choose bright colors and make the coverage semi-transparent to view base map aerials underneath.
Step. 4. Add the FEMA FIRM layer to your map, make it semi transparent, and compare the 1% floodplain boundary to your classified DEM.
A more detailed step by step description has been prepared by Dody Adkins-Perry, Engineering Technician for the Town of Bourne. Click to read Dody's summary and tips for Getting topographic information from LiDAR DEMs. Note that the exact steps may vary slightly among the 10.2, 9.x, and 8.x ArcMap licenses.
Example of an Apparent Error in the Draft Floodplain Maps in Falmouth
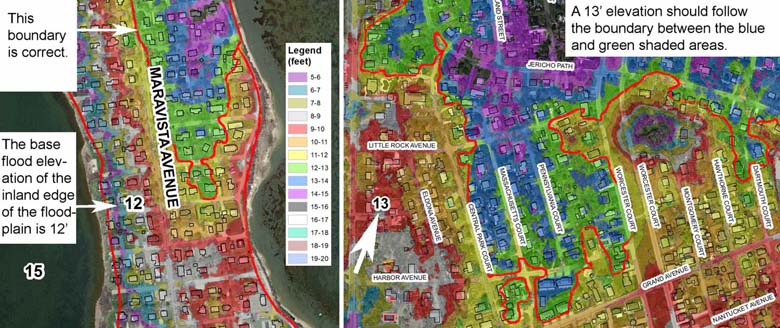
Newly available LiDAR elevation data appear to be the basis for the updated draft flood insurance rate maps (FIRMs) produced by FEMA for Cape Cod. In most of Falmouth and Bourne, there is an excellent agreement between the new LiDAR data and the inland-most boundary of the 1% floodplain. More precisely, the base flood elevation of the landward most portion of the floodplain should reasonably match the LiDAR elevation data. In the map panel to the left below, in the area of Maravista Avenue in Falmouth, the base flood elevation is 12 feet. In this area, the flood plain line (red) matches well the 12-foot area (in this case the boundary between the yellow shaded area and the green shaded area. In contrast, in the Falmouth Heights area (right panel), the stated base flood elevation is 13 feet, which is the boundary between the green and blue shaded areas. However, the floodplain boundary in this area appears to be incorrectly set at the 12-foot elevation. This apparent error will need to be addressed in the FIRM review process.

(click the map to enlarge)
Examples of where the floodplain boundary's base flood elevation is consistent with LiDAR (left), and inconsistent with LiDAR (right). Examples are from 2013 draft floodplain maps for Falmouth, MA. A more detailed view of these and other areas are contained in this map of Teaticket and East Falmouth and this map of Falmouth center.

