SLOSH Maps, FEMA FIRM Floodplains, and Map Changes
.
Explanation and Caveats
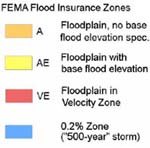
This map is for informational and planning purposes only and based on data from early 2013. Resolution of flood areas may be slightly degraded (by about 1 ft horizontal) to reduce file sizes. Please go to the FEMA website for current updates or to make a map of your area. FEMA has not finalized maps for Bourne and Falmouth (and the rest of Barnstable County), so the map for those two towns should be considered draft. Some of the files are large so it may take a minute or two to download with a slow internet connection. Drag the person icon onto the road to get a street view of the area. Click the "x" (top right of the view box) to exit street view mode.
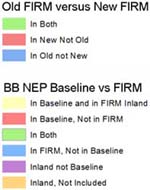
The map coverage "Old FIRM vs New FIRM" compares the 1970s-1980s FIRMs to their replacements that date from 2009 to 2013. The map coverage "BBNEP Baseline vs FIRM" compares the areas in the LiDAR data sets estimated by the BBNEP to match the FEMA base flood elevation for the site compared to the floodplain estimated by FEMA. The discrepancies between the two coverages may be the result of errors in the FEMA floodplain delineation and may warrant future study. The resolution of both these coverages have been degraded somewhat (causing shifts of 2 meters in areas) to reduce file download size. Additional analysis should be conducted with full resolution files. An explanation of these two coverages and methodologies used is contained in the 2013 draft report Discrepancies between recently updated FEMA FIRM base flood elevation boundaries and LiDAR data in Buzzards Bay.
NOTICE: The floodplain maps shown here are somewhat simplified and are for general planning purposes. They may contain errors or omissions. FEMA has provided a flood insurance program map display page for residents to make maps of their property showing the official flood insurance rate map floodplains.
Other Notes
Old FIRM vs New FIRM: This is an experimental coverage. We took a flawed older digital data coverage and, and in some areas adjusted it to better match aerial photographs to allow comparison to new maps. This methodology is imperfect, and small differences (<75 feet) between the two coverages are not necessarily significant. The resolution of this file coverage was also degraded somewhat to reduce file size to allow its display on with the Google Maps application used on this site. In the Western Half of Buzzards Bay we omitted the common areas and reduced resolution somewhat (<2 m) to improve map display speed.
BBNEP baseline vs FIRM: The BBNEP strictly applied stated base flood elevations in new FEMA flooplain maps to new LiDAR data sets. Areas where the two data sets do not agree can be used to identify where potential problems exist in the new FIRMS. An explanation of these two coverages and methodologies used is contained in this 2013 draft report Discrepancies between recently updated FEMA FIRM base flood elevation boundaries and LiDAR data in Buzzards Bay.
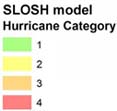
SLOSH Flooding Model: The "Sea, Lake, and Overland Surge from Hurricanes" flooding model was developed by the US Army Corps of Engineers to evaluate evacuation routes and support other planning strategies associated with severe storms. The worse case Category 2 hurricane scenario roughly matches the FEMA's 1% storm risk floodplain. The category 4 hurricane worse case scenario probably represents a 0.1% (1 chance in 1000 years) or rarer storm risk. A detailed explanation of the model can be found at this National Weather Service website. Some areas of the Elizabeth Islands have been removed from the "east" file to meet file size limits for the mapping software.
More Information & Links
This floodplain maps shown here are somewhat simplified and are for general planning purposes. They may contain errors or omissions. FEMA has provided a flood insurance program map display page for residents to make maps of their property showing the official flood insurance rate map floodplains.


