Methods Used in Study of Salt Marsh Expansion with Sea Level Rise
Last update: June 3, 2013.
For this study, we define the upper salt marsh boundary as the high tide line (HTL) which is the regulatory boundary for salt marshes under state regulations, and a federal regulatory boundary for tidal wetlands. We are predicting the landward expansion of the high marsh boundary with sea level rise using a simple "bath tub" model approach using a methodology recommended by NOAA, with some modification (see NOAA document, "Detailed methodology for mapping Sea Level Rise marsh migration:" available at www.csc.noaa.gov/slr/viewer/assets/pdfs/Marsh_Migration_Methods.pdf, last accessed 29 May 2013. See also Myers, 2005). This approach is based on modelled tidal datum elevations from NOAA' tide prediction models and NOAA's VDatum model which calculated local tidal datum elevations that can be related to real world elevations. The mapping process used is also similar to the approach used by the NOAA Coastal Services Center to map sea level rise inundation for their Sea Level Rise Viewer. The actual expansion of the boundaries of the marsh will be based on local field observations matched to LiDAR elevation data.Definitions of salt marshes
New England salt marshes are typically classified into three intertidal zones: low, middle, and high marsh based on the assemblage of plant species found in each. The plant species assemblage in each of these zones is defined by the frequency of tidal flooding and the average inundation time. In Buzzards Bay, the low marsh is dominated by cord grass, Spartina alterniflora, and begins roughly at Mean Sea Level (MSL). The middle marsh area, occurring roughly between mean high water (MHW) and mean high higher high water (MHHW) is dominated by Spartina patens, Salicornia spp., Distichlis spicata, and Juncus gerardii. The high marsh environment occurs above MHHW, and vegetation includes mid-marsh species as well as the invasive Phragmites australis. The transition between the high salt marsh and upland areas include certain characteristic species such as the high tide bush Iva frutescens, and switch grass, Panicum virgatum. Salt marshes may also grade into freshwater wetlands.There are also some regulatory definitions of salt marshes and the intertidal zone that have relevance for this study. Under the Massachusetts Wetlands Protection Act regulations (310 CMR 10.0), a salt marsh is defined as "a coastal wetland that extends landward up to the highest high tide line, that is, the highest spring tide of the year, and is characterized by plants that are well adapted to or prefer living in, saline soils. Dominant plants within salt marshes are salt meadow cord grass (Spartina patens) and/or salt marsh cord grass (Spartina alterniflora)."
In federal regulations (33 U.S.C. 1344, Regulatory Program of the US Army Corps of Engineers, Part 328.3), the "high tide line" (sometimes called the annual high tide) is defined as "the line of intersection of the land with the water's surface at the maximum height reached by a rising tide. The high tide line may be determined, in the absence of actual data, by a line of oil or scum along shore objects, a more or less continuous deposit of fine shell or debris on the foreshore or berm, other physical markings or characteristics, vegetation lines, tidal gages, or other suitable means that delineate the general height reached by a rising tide. The line encompasses spring high tides and other high tides that occur with periodic frequency but does not include storm surges in which there is a departure from the normal or predicted reach of the tide due to the piling up of water against a coast by strong winds such as those accompanying a hurricane or other intense storm."
Rather than attempt to make an ecological determination of an intermediate elevation dominated by Spartina between MHHW and HTL based on extensive field work, for this study we settled upon a calculated HTL elevation demarcation (using VDatum) for simplicity and consistency with state regulations. It is worth noting that vegetation at the HTL of larger non-tidally restricted salt marshes tends to coincide with a transitional vegetation zone between marsh species and upland species (e.g. Iva fructens grading to cedar uplands. The cedar and non-marsh vegetation is generally as evident in aerial photographs. However, based on a review of predicted HTL elevations as compared to LiDAR elevations around Buzzards Bay, this technique seems to breakdown in certain upper estuaries, most notably in the Acushnet River where apparent marsh boundaries are nearly one foot below the predicted HTL. In these environments, a LiDAR elevation that best coincides with marsh boundaries evident on aerial photographs will be selected as a starting point, and 1- 2- and 4 feet will be added to those elevations for the sea level rise scenarios.
Estimating the High Tide Line (Annual High Tide) around Buzzards Bay
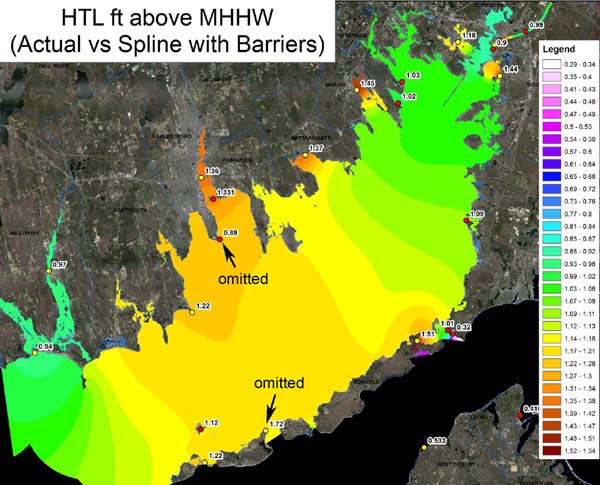
The high tide line (=annual high tide) is not an output function in the NOAA VDatum model, so the elevation must be approximated. Data for the HTL is available for 18 tidal stations around Buzzards Bay. For these elevations, we used the specific predicted annual high tide elevations above the local tidal datum as reported by NOAA for June 23, 2013. We used as a starting point the real world elevations of the Mean Higher High Water elevation as calculated by the VDatum model. Using the HTL elevations above MHHW for the 18 tidal stations in and around Buzzards Bay, we interpolated these values using Spatial Analyst in ArcGIS by Esri (ArcMap 10.2) to generate a model of the HTL elevation above MHHW for Buzzards Bay. These elevations were added to the elevations of MHHW to calculate the real world elevation of the annual high tide. We note that there are certain limitations with the HTL data, and with this approach overall, and these limitations will be discussed in the final report.The estimated high tide line elevations must be converted to LiDAR data set elevations. The methods used to accomplish this are available in the Quality Assurance Plan document. The outcome of this effort will be summarized in maps.

Click map to enlarge.
High tide line (HTL) elevation above mean higher high water as calculated in VDatum. Elevation datum is NAVD88 (GEOID12a).

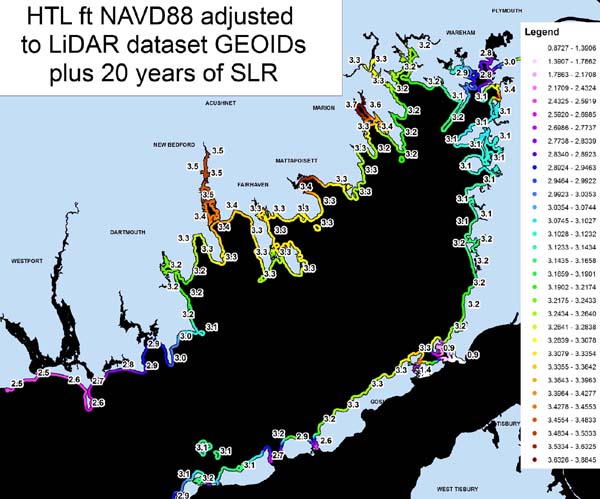
Click map to enlarge.
High tide line (HTL) elevation using the NAVD88 datum (GEOID12a), adjusted for both LiDAR data sets and 20 years of sea level rise since the last calculated tidal epoch.
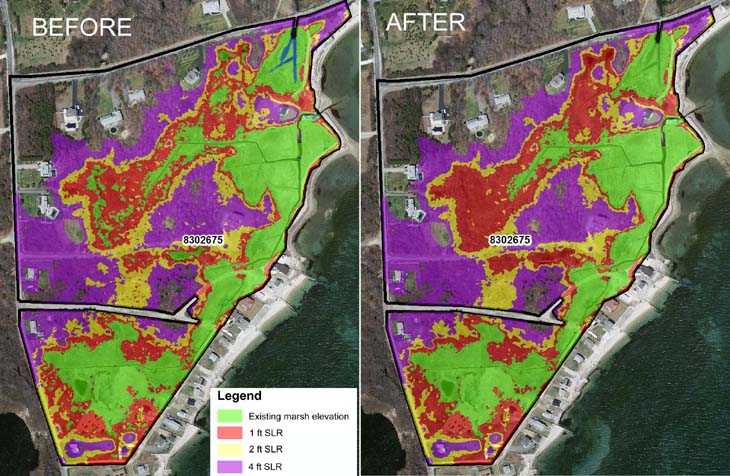
Unlike our study of the expansion of the 1% ("100-year") floodplain, where boundaries were visually adjusted to conform with FEMA floodplain assumptions and models, this study relied on a more automated analysis of the LiDAR data sets. The 2007 LiDAR data exists as contours, raw points, and triangular irregular network (TIN) digital elevation model files (DEMs). In this study, TINS are converted to IMG DEM files with 1-meter precision. The elevation points in these data files were reclassified to existing salt marsh elevation limits, and the 1-, 2-, and 4-foot increases in elevation. These reclassified DEMs were then converted to shapefiles for the corresponding elevations. These shapefiles were used to quantify both area changes and horizontal shifts in marsh boundaries. All data sets were clipped to a custom coastline developed by the Buzzards Bay NEP that had improved precision over the MassGIS TownSurvey.shp coverage. A special problem exists using this technique in that depressions within higher areas are not necessarily converted to salt marsh. To solve this problem, a simple set of logical algorithms were used to ensure that only contiguous areas of equal or lower elevation were assigned to the appropriate sea level rise scenario. Implementation of these algorithms are illustrated in the figure below.

Processing of elevation data used in salt marsh expansion study. Left shows the elevation shapefile created by converting and reclassifying TINS to elevation shape elevation zone areas. Because we assume that low depressions that are detached from existing or expanding salt marsh are not converted to salt marshes until they are regularly inundated (they are more likely to remain fresh or brackish marshes at these sites), an elevation algorithm was implemented to classify elevation depression "island" polygons in higher elevation areas into the next higher sea level rise scenario as shown by the figure at the right.
